
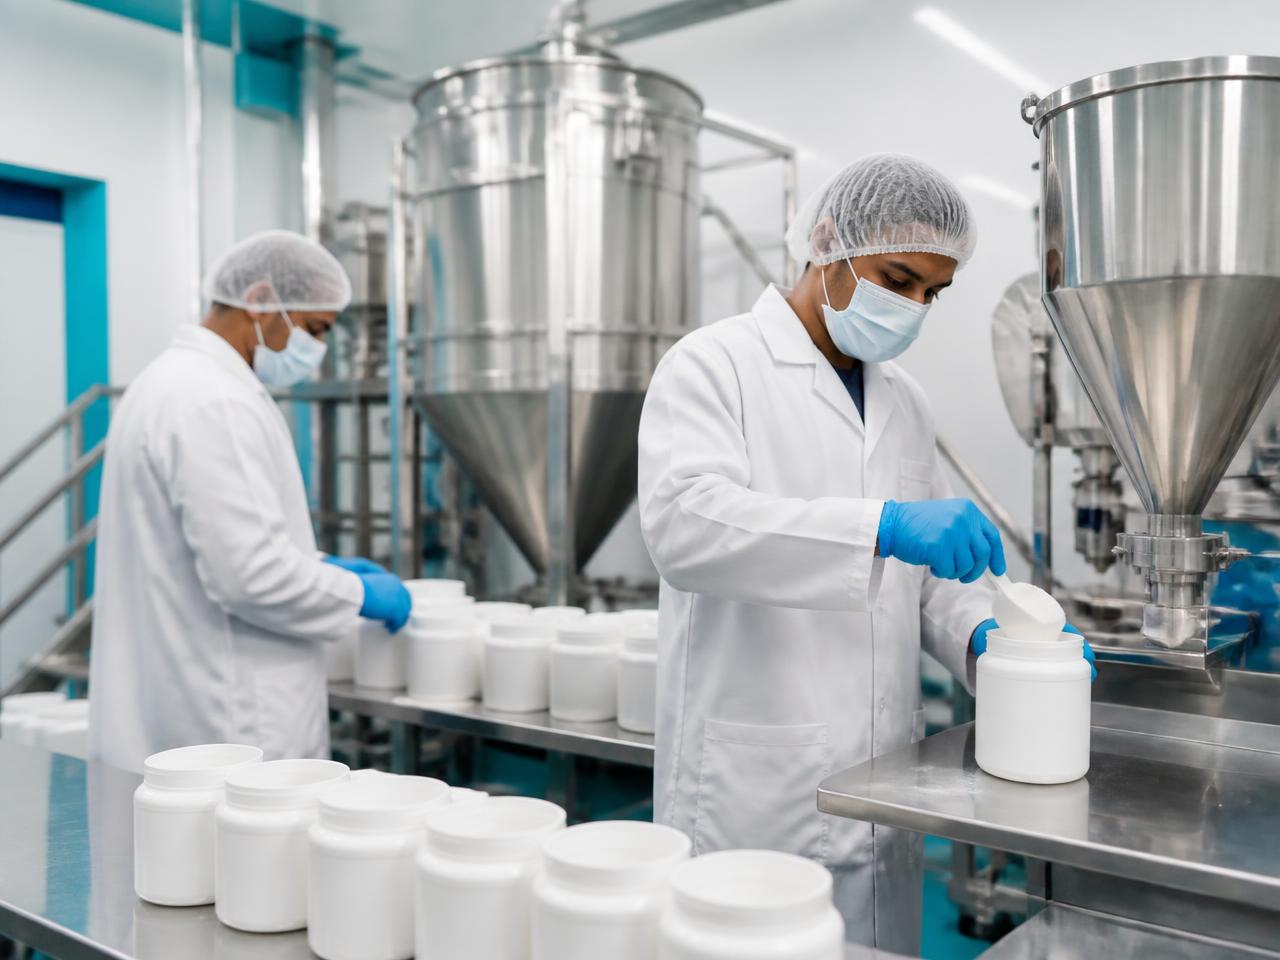
Closed-loop manufacturing
Fermentation cooling water is recovered and reused, and 20 L drums return to the plant for cleaning and refill.
ISO 9001:2015 certified · CAA registered · Antibiotic-free aquaculture solutions
Sustainability at Bio Aqua Life is not a report — it is the formulation choice we make on every SKU: biology over antibiotics, biodegradable over persistent, prevention over rescue.
Antibiotic-free inputs stop residue transfer into coastal water bodies and the food chain.
Live microbial consortia and enzyme systems that digest waste rather than mask it.
Peroxide, percarbonate and EDTA chemistry that breaks down into benign end products.
Drum return programmes for 20 L packs and recyclable secondary packaging across SKUs.
Bottom-release oxygen chemistry cuts emergency aerator hours and diesel-backed power draw.
Documented quality systems, safe workplace practice and farmer training as a social return.
Live indicators across environmental, social and governance commitments — updated as each audit and field survey closes.
Antibiotic-free portfolio
100%12 of 12 SKUs, zero antibiotic actives
Biodegradable formulations
92%Peroxide, percarbonate and enzyme chemistry
Reduction in water exchange
46%Average across monitored grow-out clusters
Emergency aerator hours avoided
28%Reported by farms on the full protocol
Three places where the environmental claim is engineered in rather than reported after the fact.
Fermentation cooling water is recovered and reused, and 20 L drums return to the plant for cleaning and refill.

Sinking peroxide chemistry delivers oxygen where it is consumed, cutting the diesel-backed aeration hours a pond needs.

Bacillus and Rhodococcus strains digest organic load instead of masking it, so nothing persistent leaves the pond.
Aeration is the single largest energy line on most farms. See what your pond is emitting today, and what a biological protocol takes off the bill.
Move the sliders to match your farm. The saving assumes the average 28% drop in aerator run-hours reported by farms on the Bio Aqua Life bottom-oxidation and probiotic protocol.
Estimated crop-cycle emissions
53.9 t CO₂e
68,930.4 kWh of aeration energy
On the biological protocol
38.8 t CO₂e
A saving of 15.1 t CO₂e per crop
19,301 kWh
Electricity avoided per crop
719 trees
Equivalent annual sequestration
Indicative estimate using 0.71 kg CO₂e/kWh grid and 0.95 kg CO₂e/kWh diesel factors. Actual results vary with pond design, stocking density and weather.
Strain potency, biodegradation profile and residue behaviour are tested before a formulation reaches a pond — and re-tested batch by batch.
0
Antibiotics across the portfolio
40%
Fewer emergency aerator hours reported
4,500+
Acres on biological protocols
100%
Batch-level traceability